
🖋️ Foreword: The Tide Shift
November started with a pullback across the portfolio. The drop was not large, but it was clear enough to show that the strong momentum from October had weakened. Markets turned softer, volatility settled, and a few high beta positions that had been climbing earlier in the year finally cooled. After a lively Uptober, this was a simple reminder that markets do not move in straight lines.
Red months tend to be more revealing than green ones. They show which parts of a strategy can hold steady and which parts were leaning too much on good conditions. November made it clear that some positions were sized a little too boldly while volatility was high, and once the environment shifted, it showed up quickly in the results.
The drawdown stayed within a normal range, although faster adjustments could have reduced some of the decline. Even so, the foundation of the portfolio stayed firm. Income continued to arrive each week and the cash reserve grew, which helped soften the overall impact.
The main lesson is simple. The challenge was not the softer market. It was assuming that volatility would stay elevated for longer and reacting a little too slowly when it began to fade. November served as a useful reset. It highlighted the need for steadier sizing, firmer discipline, and timely adjustments as the portfolio moves into its next stage.
🖼️ Visual Summary
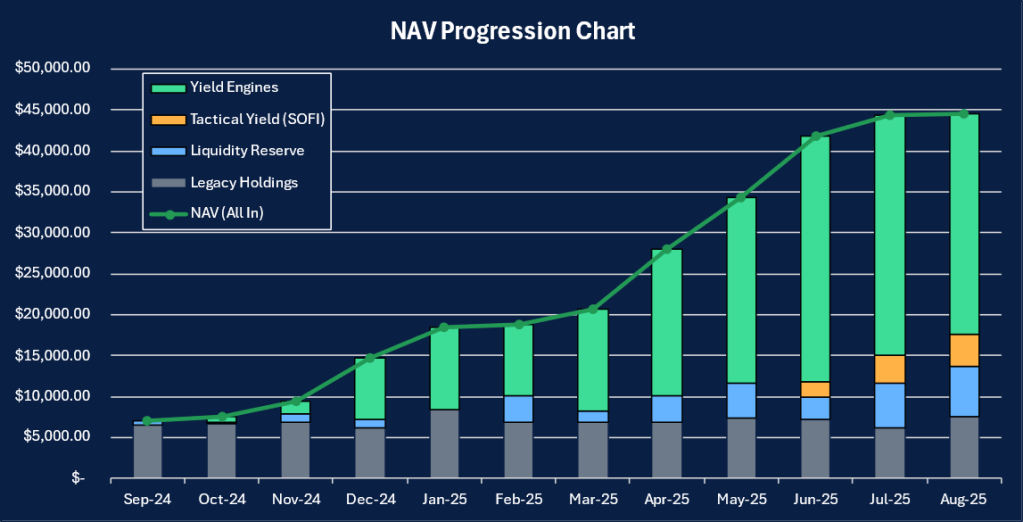
📊 NAV Progression
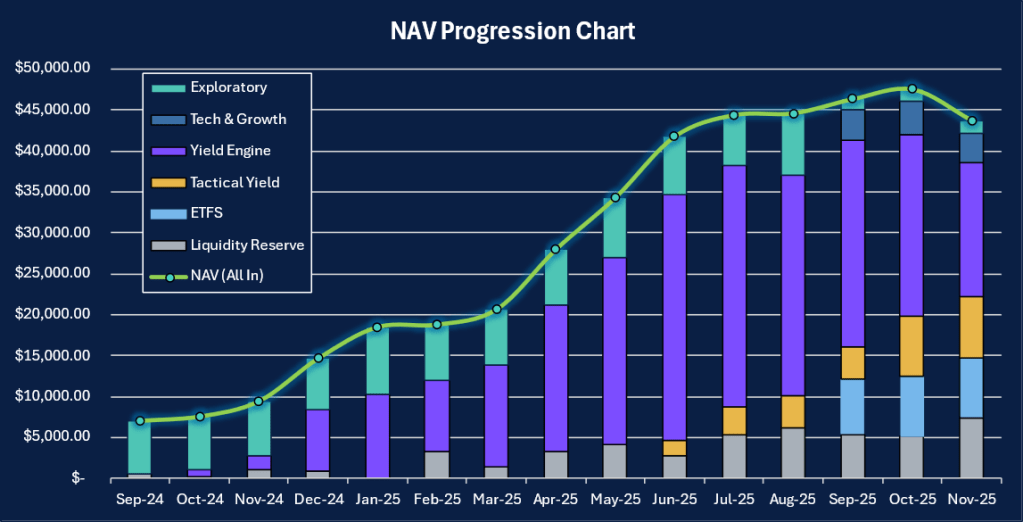
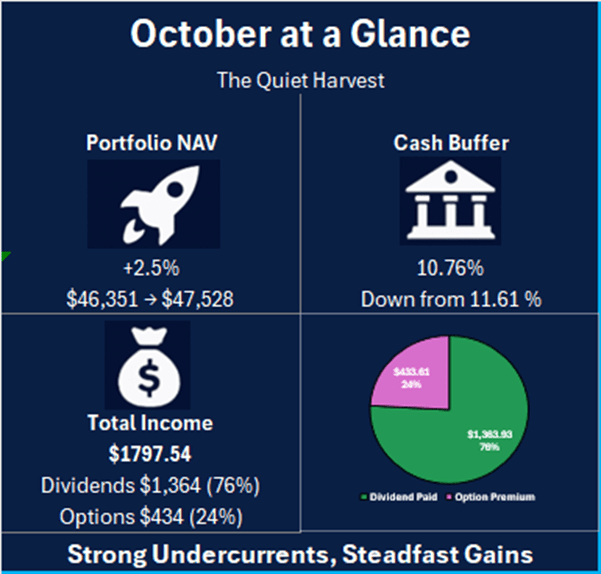
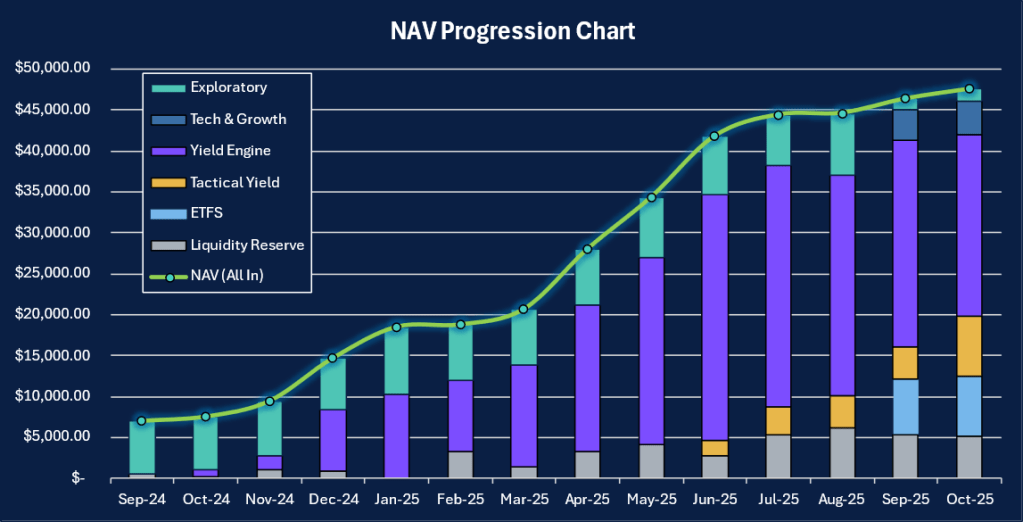
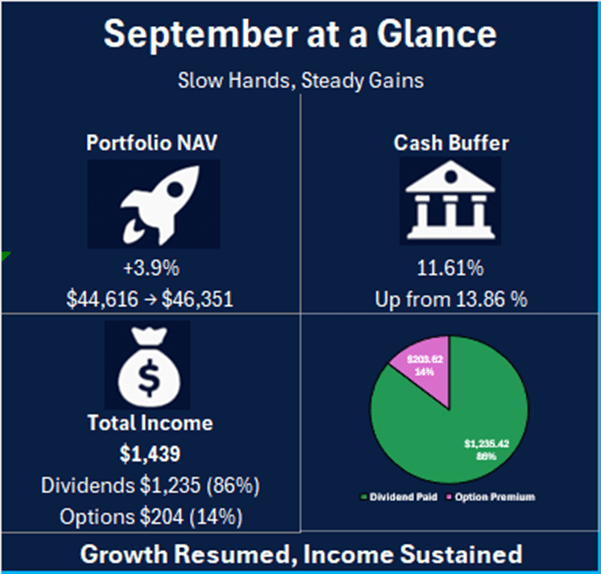
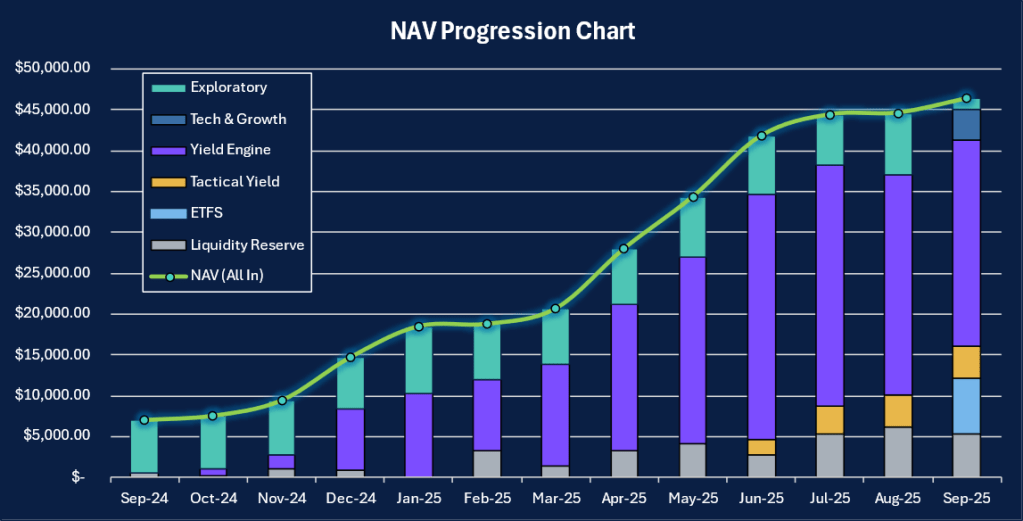
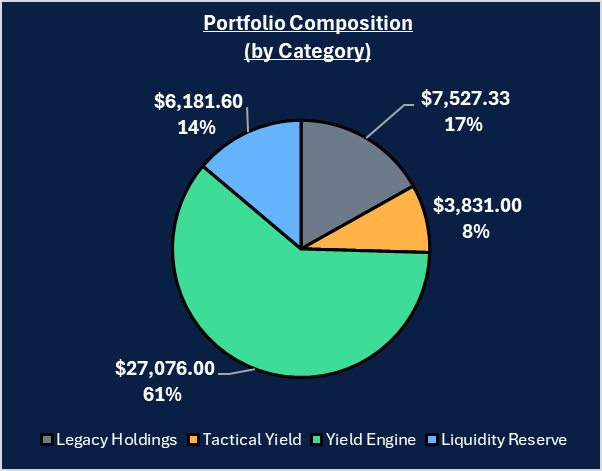
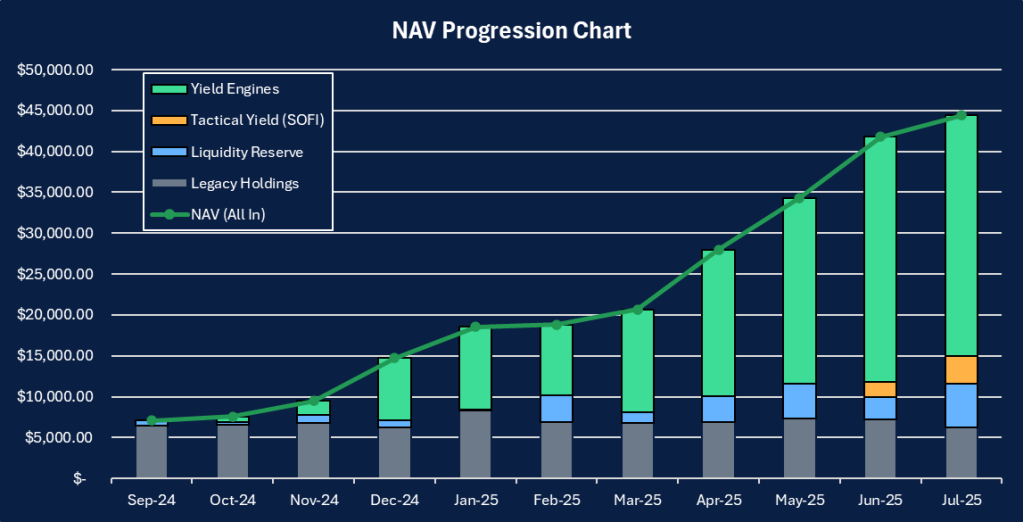
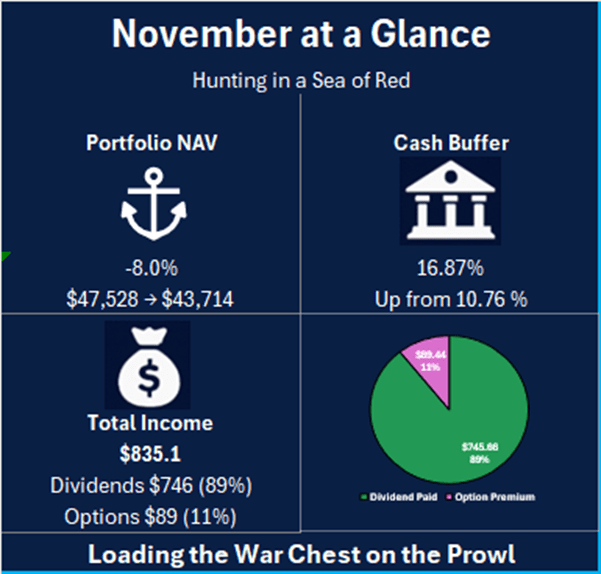
The steady climb of the past quarter met a clear pause in November. The portfolio closed the month at $43,714, an 8.0% pullback from October’s peak. On the chart, this drop ends a four-month stretch of gains and brings Net Asset Value back to levels last seen in late August.
The shift becomes clearer when viewed through the asset breakdown. October’s high was supported by strong volatility, firm crypto sentiment, and an expanding Yield Engine. As these conditions eased in November, the Yield Engine gave back more than $5,500. Most of the contraction came from the cooling in crypto linked exposures and high beta positions. Tech and growth names softened as well, which added to the decline.
The Liquidity Reserve moved in the opposite direction. The increase came from two sources. First, weekly income from dividends and option premiums was kept in cash instead of being redeployed. Second, the monthly cash deposit for November was added directly to the reserve. Together, these pushed the cash buffer 44.0% higher than the month before.
The overall picture is one of adjustment, not deterioration. Value pulled back, but the capital base strengthened. Higher liquidity, reduced dependence on elevated volatility, and a clearer sense of where risk had built up. The chart reflects both sides of the month. A correction in price, and a deliberate move toward stability before the next deployment.
🔑Key Takeaways
- NAV Pulled Back
The portfolio closed at $43,714, down 8.0% as crypto linked equities corrected. The structure held, but the drop reflected the sensitivity of high beta positions during a softer volatility environment. - Income Stepped Down
Monthly income came in at $835, a 53.5% decline. Lower payouts from MSTY and CONY and a temporary reduction in option activity drove the decrease. Even so, the 1.9% yield on NAV remained healthy. - Liquidity Reserve Strengthened
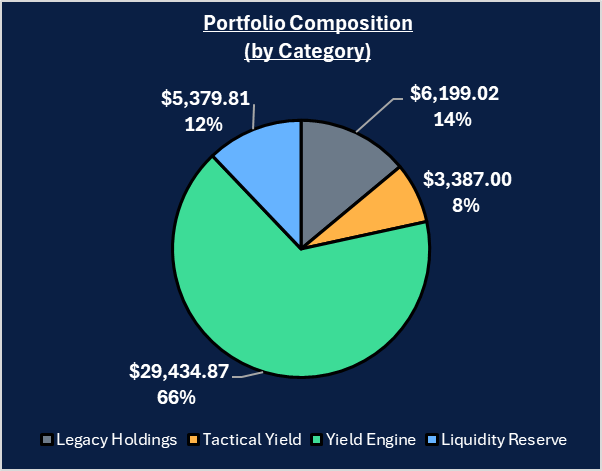
The reserve rose to $7,374 or 16.9% of NAV. Fresh capital and unreinvested dividends lifted the buffer. With markets turning down, holding more cash was the right defensive call. - Yield Engine Weakened
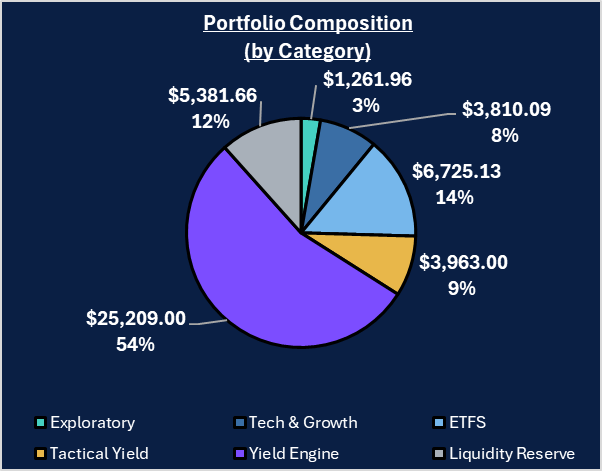
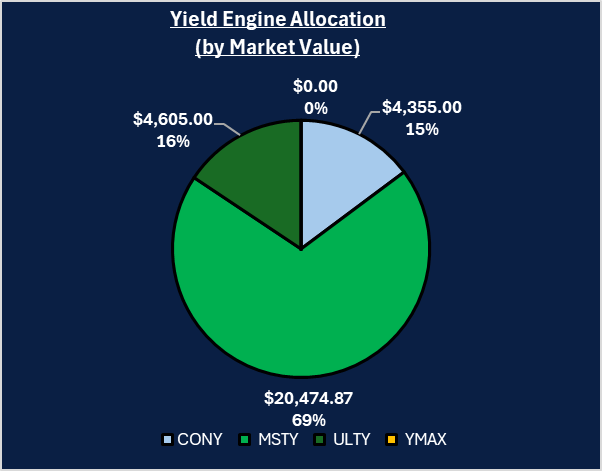
The Yield Engine fell to $16,485 (25.2%). MSTY, CONY, and ULTY mirrored the broader crypto correction. Their upcoming reverse splits highlight how sharp the price erosion was, but they do not alter the strategy. - ETFs Offered Stability
CSPX, IWDA, and VWRA ended at $7,347, essentially unchanged. This sleeve helped steady the portfolio during the drawdown. - Tactical Yield Stayed Productive
SOFI finished flat at $7,430, while managed spreads still delivered nearly $90 in premiums. This sleeve continued to generate income despite muted price action. - Tech and Growth Cooled
The segment fell 13.9% to $3,576, with Cloudflare and Nvidia leading the decline. The move looked like normal consolidation after earlier strength. - Exploratory Assets Mixed
This sleeve closed at $1,501, up 3.2%, with gains in MetaOptics offset by losses in Luminor. The segment remains small and experimental. - Framework Held Steady
November tested the Slow Hands approach. The drawdown was controlled, cash increased, and income continued. The key lesson is tighter position sizing in the Yield Engine when volatility starts to fade.
⚠️ The Reality Check: What Went Wrong?
Not everything can be explained by market conditions. November exposed a few avoidable mistakes that need to be acknowledged clearly.
- Mistimed Entry into MSTY
The addition of 100 MSTY shares on 3 Nov was premature. The price was still trending down, and the correction accelerated shortly after, putting the position underwater almost immediately. The strategy behind MSTY remains valid, but a mid month consolidation or a post split entry would have offered a stronger setup. - The Odd Lot Problem with 5UA
Luminor Financial fell 15.2%, and the small position of 33 shares created an inefficient outcome. Trading fees exceed the value of the stake, turning it into a non productive holding that cannot be exited cleanly. It is a small mistake, but still a drag on flexibility. - Insufficient Protection on High Beta Exposure
The Yield Engine carried too much unhedged risk while volatility fell and Bitcoin corrected nearly 30%. SOFI was managed well, but MSTY and CONY were left fully exposed during the downturn. This oversight amplified the drawdown and highlights the need for tighter safeguards when rotating into high beta assets.
🧩Portfolio Updates

November delivered sharp divergence across the portfolio, with each sleeve reacting differently to the broader reset.
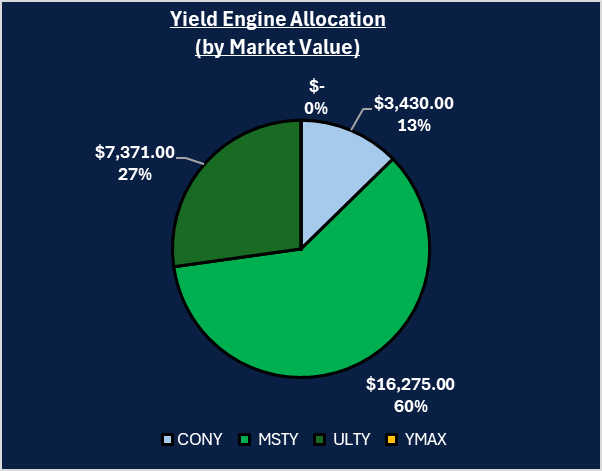
Yield Engine (MSTY, CONY, ULTY)
This sleeve saw the steepest decline, ending the month at $16,485, down 25.2%. The pullback came mainly from the correction in Bitcoin, which moved from $111,000 to the low $80,000 range. MSTY fell 29.6% and CONY dropped 24.6%, reflecting their high sensitivity to crypto volatility. The exposure remains part of the long term income strategy, but the month highlighted the cost of carrying high beta positions during a volatility cooldown.
ETFs (CSPX, IWDA, VWRA)
The ETF base did its job. CSPX, IWDA, and VWRA finished at $7,347, essentially flat at 0.1%. While crypto linked assets swung sharply, the ETF layer provided stability and limited the overall drawdown. This sleeve continues to anchor the portfolio.
Tactical Yield (SOFI)
SOFI closed the month at $7,430, up 0.1%. The stability came from active spread management rather than directional gains. Nearly $90 in premiums were collected despite the quiet price action. This sleeve remains a reliable income generator when broader markets lose momentum.
Tech & Growth
This segment fell 13.9%, ending at $3,576. Cloudflare dropped 21.0% and Nvidia declined 12.6% as part of the rotation out of high growth and AI names. The move is viewed as normal consolidation following a strong run earlier in the year, and the positions remain structurally intact.
Exploratory Footprint
Results were mixed, but the sleeve finished at $1,501, up 3.2%. MetaOptics (9MT) gained 10.5%, while Luminor (5UA) fell 15.2% and remains difficult to exit cleanly due to odd lot sizing and fees. This sleeve remains small and experimental by design.
Liquidity Managed
The Liquidity Reserve increased 44.2% to $7,374. The rise came from fresh capital and income that was intentionally held rather than reinvested. In a declining market, this shift toward liquidity added stability and positions the portfolio for future opportunities.
🌐 Market Update
Volatility & Rates
November began with expectations of stability. Bitcoin was projected to hold above the $100,000 level, and the broader AI narrative suggested another month of constructive volatility before liquidity thinned in December. Instead, macro conditions turned earlier than anticipated. A sharp risk off shift followed renewed volatility in US Treasury yields, softer employment indicators in the Federal Reserve’s Beige Book, and reduced global liquidity as Japan signaled a gradual move away from ultra loose policy. These developments tightened financial conditions and weakened appetite for high beta assets.
For the portfolio, this meant stepping back from aggressive positioning. Option volatility remained elevated, which allowed the Yield Engine to continue generating income, but capital values declined. The Liquidity Reserve grew as dividends, option premiums, and new capital were held back from deployment. This preserved flexibility without chasing unstable price action.
Crypto & Equity Performance
Market expectations entering the month centered on Bitcoin holding its floor near $100,000 and preparing for a year end rally. Equities were expected to broaden beyond AI leaders, with fintech and small caps set to participate. That narrative reversed quickly. Bitcoin retreated from $111,000 into the low $80,000 range, pulling crypto linked equities lower. MSTY fell 29.6% and CONY declined 24.6%, reflecting their sensitivity to crypto movements. At the same time, the AI trade paused. Nvidia’s record earnings on 19 Nov triggered a sell the news reaction, signaling that strong results were already priced in. Cloudflare and other high growth names declined as capital rotated toward defensive sectors.
The portfolio’s diversification softened the impact. ETFs remained stable and provided ballast, while SOFI held flat due to active spread management that continued to generate income despite minimal price movement. Total income reached $835 and was directed entirely into cash. The portfolio exited November with a lower NAV but a stronger liquidity foundation.
Outlook for December
December opens with attention focused on the Federal Reserve’s meeting scheduled for 9 to 10 Dec. Markets are pricing a high probability of a 25 basis point rate cut. If delivered, this could support a short term rebound in technology and crypto assets. If the Fed holds steady or reiterates caution, volatility may remain elevated into year end.
The Yield Engine will also undergo structural changes. MSTY, CONY, and ULTY will complete their reverse splits in early December. These adjustments may create temporary price irregularities, so trading in these names will pause until conditions stabilize. With a larger Liquidity Reserve and clearer awareness of recent risks, the portfolio enters December positioned to respond rather than react.
🎯Objective Review
Here’s how we performed against our August targets at a glance:
Base Goals
Income Goal: Generate at least $1,700
Status: ❌ Missed
Actual: $835
What Happened:
Income fell well below target as the Yield Engine contracted sharply. With MSTY and CONY down more than 25%, the absolute dollar value of distributions declined. Option income also slowed due to reduced trading activity during the holiday period.
Assessment:
The income target did not hold under a fast drawdown. Yield output could not compensate for the shrinking capital base.
Liquidity Reserve: Maintain 10% to 12%
Status: ⚠️ Exceeded
Actual: 16.87%
What Happened:
Cash levels rose as dividends, option income, and the monthly capital deposit were held back from deployment. Total reserves reached $7,374.
Assessment:
The reserve exceeded the target range, but this was a deliberate defensive choice, not an execution miss.
Equity Exposure: Add selectively to CSPX/IWDA
Status: ⏸️ Not executed
What Happened:
The ETF sleeve remained stable, but conditions were not favorable for new deployment. Liquidity was prioritized over incremental exposure.
Assessment:
Pausing allocation here was appropriate. Macro signals did not justify additional equity risk.
Option Selling on SOFI: Only if put premiums exceed 2.5% of strike
Status: ✅ Achieved
What Happened:
SOFI generated several option opportunities through November. You opened a short put on 14 Nov at the $26.50 strike, receiving a premium of $79.24, which exceeded the 2.5% threshold. All other put exposure was managed through buy to close orders, including the closure of the $29.00 put early in the month.
Calls were traded separately for risk control. Two covered calls were sold on 3 Nov and 12 Nov at the $33.00 and $34.00 strikes, generating $46.16 and $54.16 in income. These were not based on the 2.5% rule and were used tactically to manage position risk.
The remaining call and put transactions on 14 Nov were closeout legs, reducing exposure as volatility dropped. Total net option income for the month was $89.44.
Assessment:
Execution stayed within strategy. Put sales followed the premium rule, calls were used defensively, and overall income was generated without taking on unnecessary directional exposure.
Yield Engine Stability: Hold and reinvest only if prices drop more than 5%
Status: ⚠️ Mixed
What Happened:
The decline triggered the reinvestment condition, but the MSTY entry on 3 Nov was early. The correction accelerated immediately after the buy, placing the position into drawdown.
Assessment:
The rule was correct, but execution timing lagged. More patience would have improved the entry.
Stretch Goals
Total Income above $1,900
Status: ❌ Missed
NAV Growth of $1,500 to $2,000
Status: ❌ Missed
NAV contracted by $3,814.
Deploy up to $1,000 into ETFs on weakness
Status: ❌ Missed
Deployment was cancelled to strengthen liquidity.
Risk Management: Maintain neutral delta and avoid overexposure to crypto
Status: ⚠️ Partial
SOFI remained controlled, but the Yield Engine carried too much unhedged beta as volatility dropped.
Exploratory Layer under 3% NAV
Status: ✅ Met
The sleeve ended at 3.4% due to NAV contraction, not new allocation. MetaOptics (9MT) gained 10.5%, supporting the hold.
Scorecard Summary
We fell short on growth and income goals due to the broad pullback in crypto linked and high growth assets. However, risk discipline held where it mattered. Liquidity was strengthened, SOFI was managed effectively, and exposure was not increased recklessly. The month did not meet profitability targets, but the portfolio passed a practical stress test without structural damage.
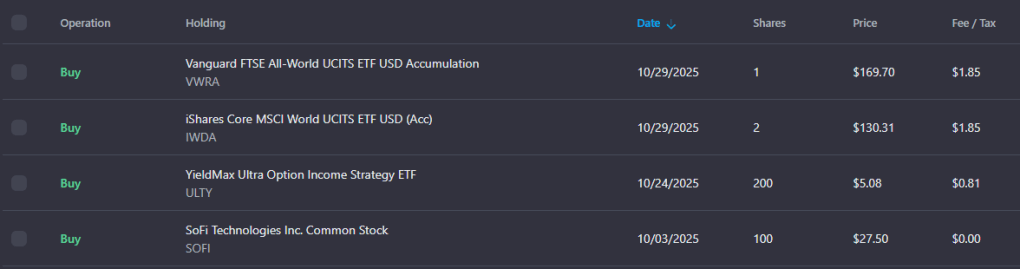
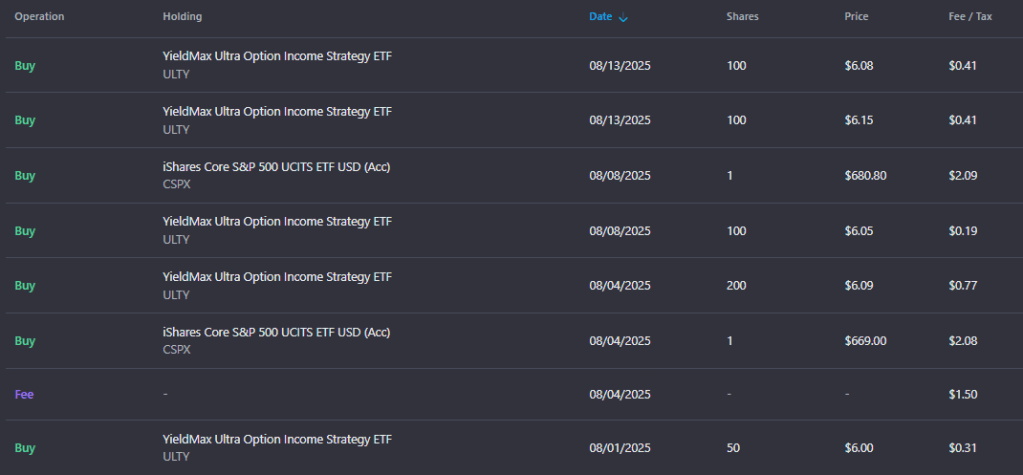
📁Transactions
November Transactions
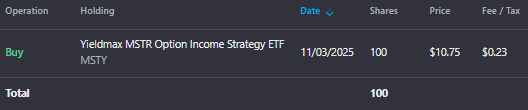
MSTY
Bought 100 shares at $10.75 on 3 Nov.
This addition increased the Yield Engine ahead of the anticipated volatility cycle. The timing proved early, as the crypto market corrected sharply soon after. The position remains part of the core income sleeve and will move through the reverse split in early December.
SOFI Options
Activity in SOFI was tactical and rule based. Put sales were executed only when premiums exceeded the 2.5% threshold. Call activity was defensive and used to manage risk, not to chase income.
| Transact | Action | Type | Strike | Premium | Notes |
|---|---|---|---|---|---|
| 3-Nov | Sell | Call | 33.00 | $46.16 | Defensive call to control upside exposure |
| 12-Nov | Sell | Call | 34.00 | $54.16 | Managed within range, not tied to premium requirement |
| 14-Nov | Sell | Put | 26.50 | $79.24 | Premium exceeded threshold; primary income driver |
| 14-Nov | Buy | Put | 29.00 | -$75.84 | Closed earlier put exposure as volatility dropped |
| 14-Nov | Buy | Call | 33.00 | -$2.14 | Closed short call position |
| 14-Nov | Buy | Call | 34.00 | -$12.14 | Closed second short call position |
Net Option Income: $89.44
The put sale at $26.50 provided most of the month’s income and satisfied the premium requirement. Call transactions focused on reducing exposure as the volatility cycle shifted. The sleeve performed within strategy despite limited price movement in the underlying.
Liquidity Reserve:
Added approximately $2,300 of fresh capital. Rather than deploying immediately, new capital was held in reserve as markets weakened. Combined with dividends and option income, this lifted the Liquidity Reserve to 16.9% of NAV, strengthening downside protection during the correction.
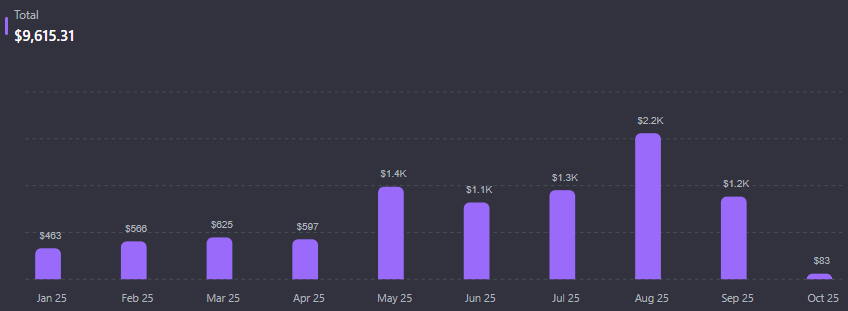
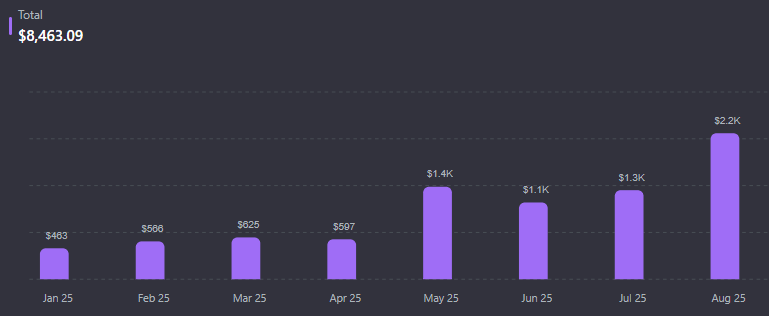
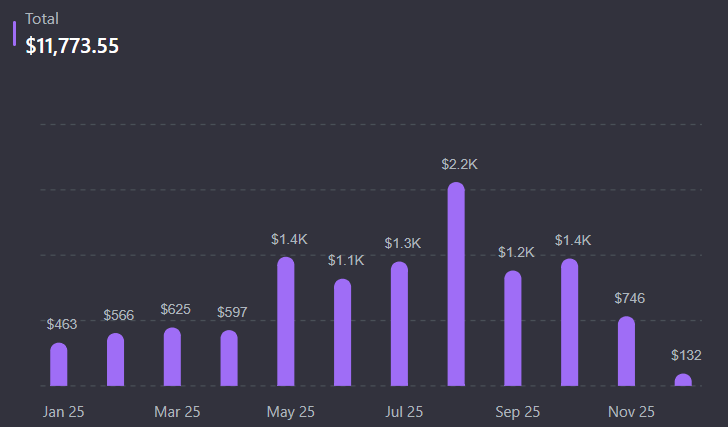
🏦 Income Overview
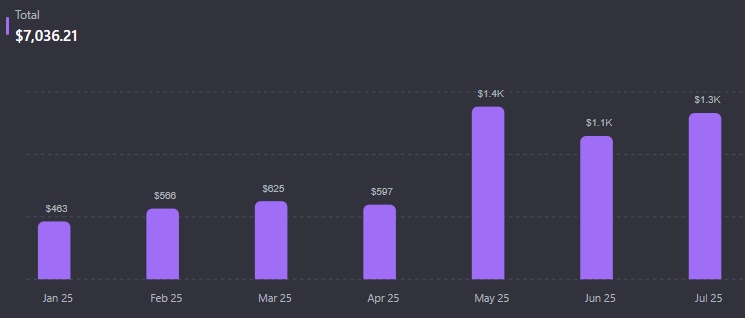
Total income for November came in at $835.10, a 53.5% decline from October. Dividends contributed $746 or 89%, while options added $89.44 or 11%. The drop reflected the contraction in asset values and the planned reduction in trading during softer volatility conditions.
The income mix shifted heavily toward dividends as reduced volatility and a two-week trading pause limited option activity. Despite the contraction, income generation continued and the portfolio maintained positive cash inflow through a difficult month.
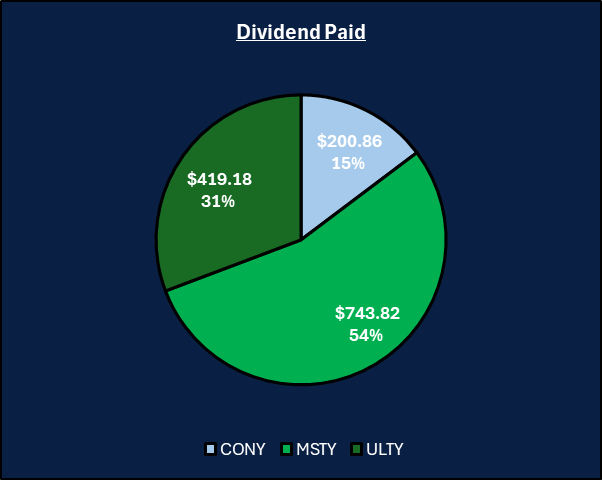
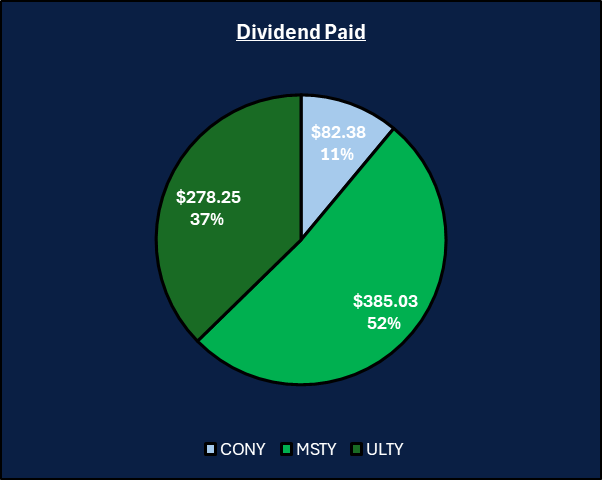
Dividend Highlights ($746)
Dividend output declined as the Yield Engine corrected, but distributions remained consistent relative to the reduced base.
- MSTY: $385.03
- ULTY: $278.25
- CONY: $82.38
These payouts supported the expansion of the Liquidity Reserve despite the broader drawdown.
Dividend output fell in line with asset prices as MSTY and CONY declined by roughly 25 to 30 percent. Distributions remained consistent relative to their reduced base values.
Option Activity ($89)
All option income came from SOFI. Activity was selective and followed the premium rule for put sales.
- Early Month
- Sold calls at $33.00 and $34.00 to harvest available premium.
- Mid Month
- Closed both calls on 14 Nov.
- Closed the $29.00 put to reduce exposure.
- Sold the $26.50 put, which met the 2.5% premium threshold and generated most of the month’s income.
- Outcome
- The sequence produced $89.44 in net income. Execution remained disciplined and avoided unnecessary directional exposure.
Yield Profile
- Overall Yield: 1.9 %
- Dividends: 1.7 %
- Options: 0.2 %
The decline in overall yield reflects November’s volatility contraction and reduced option flow. Even so, the portfolio continued to generate steady income through dividends, supported by disciplined position management.
🔭 Next Steps
We enter December with a defensive posture but an offensive mindset. The goal is to stabilize the portfolio while preparing for selective redeployment when conditions improve.
Area of Focus
- Monitor the Reverse Splits
MSTY, CONY, and ULTY will complete their reverse splits in early December. MSTY will consolidate at a 1 : 5 ratio. We will wait for these adjustments to settle before adding exposure, as liquidity often becomes erratic around corporate actions. - Deploy Cash (Conditional)
The portfolio holds more than $7,300 in dry powder. Deployment will remain conditional on crypto stability.- If Bitcoin holds support at $90,000 for three consecutive days, we will begin averaging into MSTY to lower the cost basis.
- If Bitcoin breaks below $85,000, the Liquidity Reserve remains untouched.
- Contain the Zombie Position
Luminor Financial (5UA) will be classified as a zombie holding. The odd lot size and high exit fees prevent a clean unwind, so it will no longer influence active strategy decisions. It remains in the portfolio only as a reminder of the importance of liquidity and position sizing. - December Income Target
With the portfolio reset lower, the focus shifts to rebuilding income. The target for December is to reclaim the $1,000 level by taking advantage of the typically higher volatility premiums that accompany year end positioning. Execution will remain selective and rule based.
📅 Month 15 Objectives
✅ Base Target
- Income Goal: Generate at least $1,000
November closed at $835, below the four digit target due to the price decline across the Yield Engine. Restoring income above $1,000 is the primary objective for December. This stabilizes monthly cash flow and supports the rebuilding of NAV. - Deploy capital to reach ~14% of NAV
The Liquidity Reserve sits at 16.9% of NAV. The goal is to rebalance this toward 14% through a mix of earned income and selective deployments. The expected outcome is an NAV increase of $1,500 to $2,000, driven by normalized income and cautious reinforcement of the ETF base. - Strategic Deployment:
Deployment remains conditional. If Bitcoin holds $90,000 for three consecutive days, approximately $1,500 will be allocated to MSTY to reduce the cost basis. Larger moves will wait until after the Federal Reserve meeting on 10 Dec. This avoids pre positioning ahead of a potentially market moving event. - Maintain SOFI Collars
SOFI continues to trade near resistance, and downside protection remains inexpensive. The focus for December is controlled yield. Collars will be managed actively, but the priority shifts from maximizing premiums to preserving capital as volatility resets.
🚀 Stretch Goal
- Income Goal: Exceed $1,250
Aim to capture elevated volatility premiums that often accompany post split adjustments and year end rebalancing. This target builds on the base goal and reflects the potential for higher option flow if market conditions stabilize. - Recover 50% of November Drawdown (+$1,900)
A recovery of approximately $1,900 would offset half of November’s decline. A confirmed 25 bp rate cut at the Federal Reserve meeting on 10 Dec could act as the catalyst, particularly for tech and crypto assets that were heavily discounted last month. - Strategic Deployment:
Up to $2,500 may be deployed if Bitcoin reclaims $100,000. A break above this level would signal that the correction has likely ended. In this scenario, the stance shifts from defensive to momentum driven, reducing cash drag and positioning the portfolio for upside. - Risk Management: The Circuit Breaker
If Bitcoin closes below $85,000 for three consecutive days, all deployments will stop. Cash will remain at elevated levels (17%+) until January. The priority is capital preservation, not averaging into a deepening decline.
🧠 Final Thoughts
Month 14 reminded us that in high yield investing, volatility is the price we pay for performance. We paid that price in November. An 8% pullback is never pleasant, and missing the income target is a clear setback. Even so, the real measure of a portfolio is not how it behaves in a rally, but how it holds together when conditions shift.
By that measure, we stayed intact. There were no panic exits and no collapse in structure. Income continued, the Liquidity Reserve rose to nearly 17%, and the framework absorbed the correction without breaking. NAV took a hit, but the portfolio ended the month with more cash, more flexibility, and a clear plan for the path forward.
The message from November is direct. The strategy works. Execution must tighten. We enter December with a bruised NAV but a full war chest, prepared to act with intention rather than reaction.
The tide has turned. The direction from here will be shaped by discipline, patience, and the quality of our decisions.
💬 Let’s Talk
November was rough on the NAV, but it sharpened the strategy. I am curious how you approached the same environment. Did you pull back and build cash, or did you lean in and buy the dip while everything was selling off?
Drop your approach and your reasoning below.